Key features:
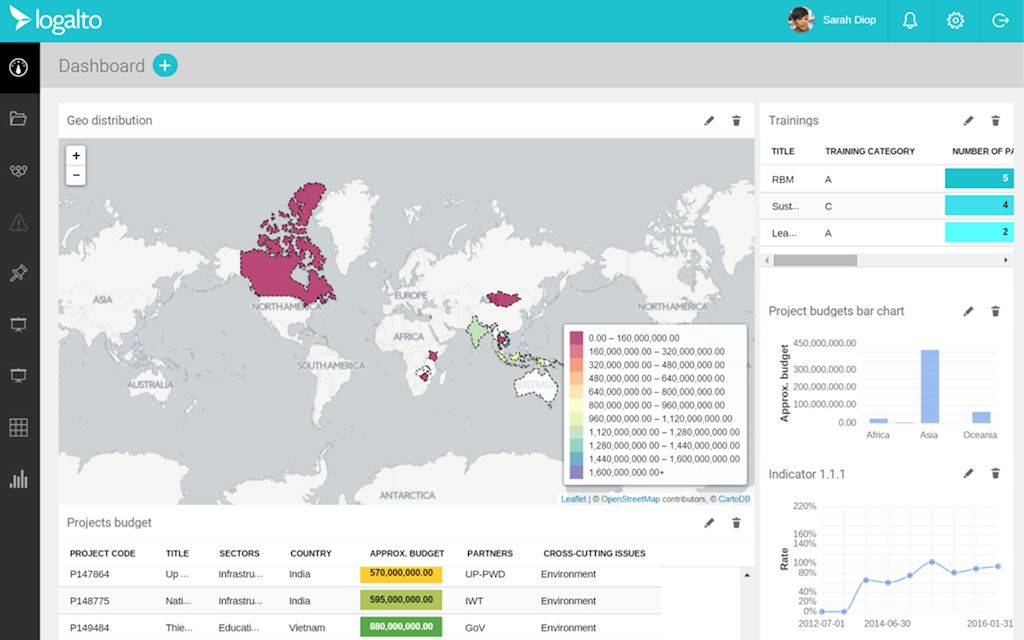
When users log in, the first page they see is the global dashboard. The global dashboard displays information relevant for the entire NGO or nonprofit.
Widgets (data visualizations) displayed on the global dashboard generally present aggregated data rather than project-specific information.
This global NGO dashboard is configured by a specific person (your LogAlto administrator) and it displays the same information to all users.

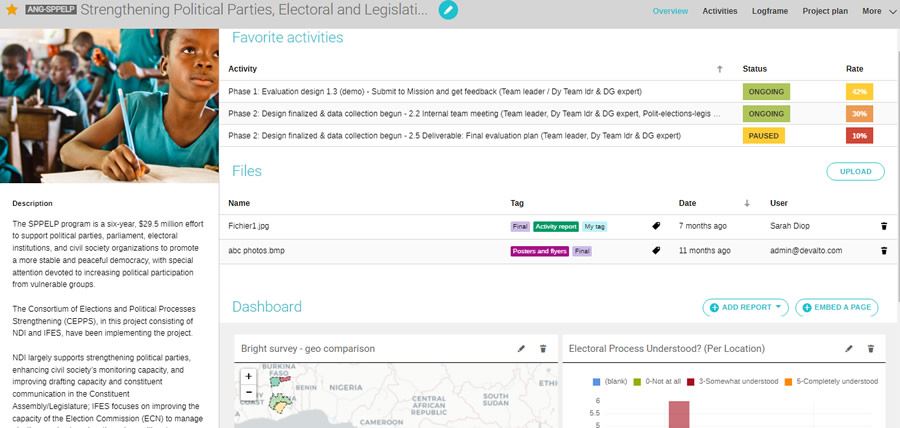
The project monitoring and evaluation dashboard can be accessed via the Project portfolio module.
Widgets (data visualizations) displayed on the project dashboard generally present data aggregated at the project level.
These dashboards are configured by specific users (depending on their access rights) and it displays the same information to all users.

This dashboard allows each user to configure their own monitoring and evaluation dashboard displaying only information that they find the most relevant or useful.
The user dashboard is easily accessible upon login, in a tab right next to the global dashboard tab.

You can create a user account for your donors and gives them access to all features (read only).
You can also only give them access to a pre-configured monitoring and evaluation dashboard that display only aggregated information relevant to them.

![]()
Users can create monitoring and evaluation dashboards by adding and removing widgets, placing them in the location of their choice (drag and drop), or resizing them.
![]()
Widgets can be easily created using the Analytics (data visualization) module, which allows you to create a wide variety of reports for your monitoring and evaluation dashboards: grids, pivot tables, pie chart, radar chart, icon chart, location map, distribution map and more.
![]()
It can also be useful to embed external pages to your monitoring and evaluation dashboards. For example: Dashboard in a 3rd party software or web portal, website (either the NGO or nonprofit’s website, or the project’s website), chart or image from an external website.
![]()
If LogAlto’s monitoring and evaluation dashboard does not fit your needs, the Power BI integration allows you to aggregate and analyze data and create dashboards that can be embedded in LogAlto's monitoring and evaluation dashboard. It is also possible to integrate LogAlto with another NGO dashboard software.
Request a demo to learn more about how LogAlto can help your organization create insightful dashboards.
Subscribe to our Quarterly Newsletter!