If your organization is looking for a logframe software, LogAlto can help you design and organize your logframes data in a collaborative, centralized and standardized manner.
Key features:
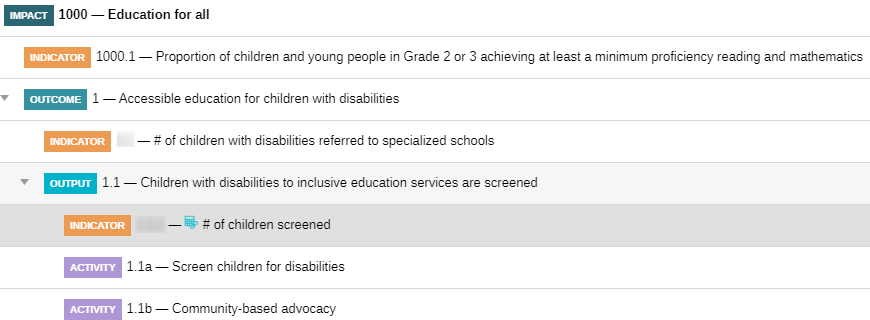
The logframe design interface allows to easily create items like goals, outcomes, outputs and indicators. The various items can be rearranged and re-ordered using drag-and-drop. Each level is color-coded, making it easier to read and navigate. You can display or hide information (metadata fields like “data source”, “collection method”, “risks”, etc.) depending on what is the most useful to you.
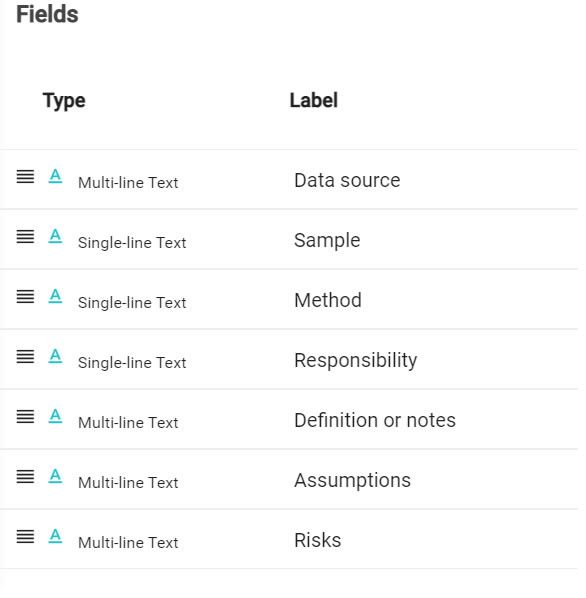
LogAlto allows you to choose what kind of information is relevant in your monitoring and evaluation frameworks. You can configure required data fields for each analytical level (ex: outcomes, outputs, indicators). If your organization’s needs change over time, don’t worry: the required fields can be modified even once the system is launched.
Some organizations may think they would need multiple logframe software because they have different types of monitoring and evaluation frameworks, with different wording and analytical levels. Fortunately, LogAlto allows you to configure the analytical levels and wording for each logframe. Instead of having Goals, Outcomes, Outputs, you could choose to have Objectives, Impacts and Results, or any other items on any number of levels. The vocabulary used is 100% customizable.
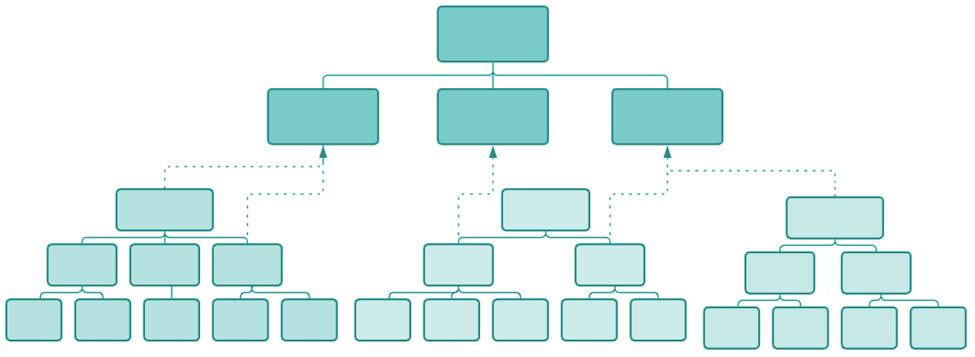
LogAlto allows you to manage monitoring and evaluation frameworks at various levels:
Logframes at higher levels can contain “corporate” outcomes, outputs or indicators that can be added (mandatory or optional) to logframes at the project level. Doing so, indicators’ values at the project-level can be compared and aggregated at the higher levels.
If your organization only needs a logframe software to manage monitoring and evaluation frameworks at project level, please note that you don’t need to create global logframes in LogAlto, it is only optional.
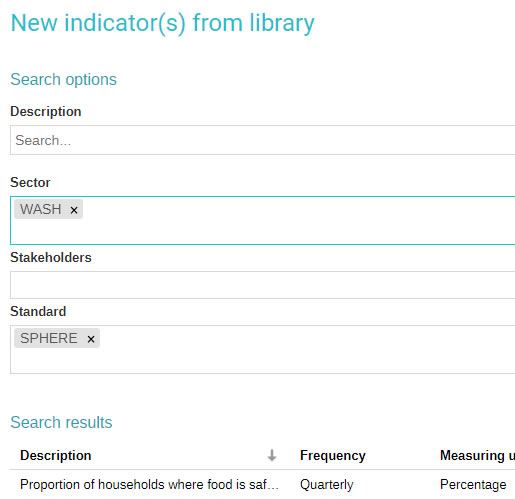
LogAlto’s indicator library allows you to browse indicators by categories, sectors, tags or other criteria, and easily add them to logframes. The library is populated by your LogAlto administrator with indicators from various sources and standards, that are relevant for your organization. This feature is very useful for logframe design, especially for users that have not a lot of experience in designing M&E logframes or if the organization often implements very similar projects that could use similar indicators.
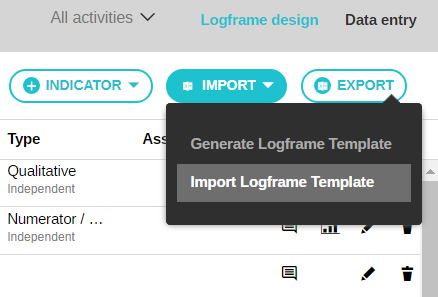
LogAlto offers tools to export your M&E logrames and to import from Excel. This is very useful, especially if you already have a logframe in Excel format or if you need to transfer data from another logframe software.
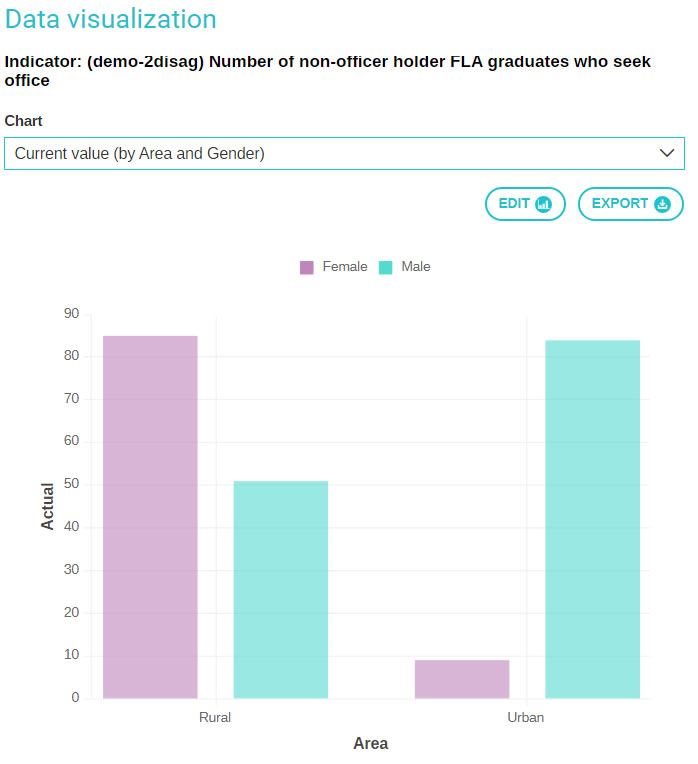
You don’t necessarily need a 3rd party software to pull out useful information from your logframe software. A good logframe software should allow you to analyze and visualize your data, or at least to export it so it can be analyzed in Excel or some other tool.
LogAlto’s Analytics module allows you to analyze and aggregate M&E logframes data in various ways:
![]()
Any project field (project type, sector, donor, location, cross-cutting issues, type, etc.)
![]()
State/district, country, region or globally
![]()
Organizational unit (division, country office, etc.)
If your organization already uses a logframe software, our team can help you transition from your old logframe software to LogAlto by importing existing data.

Request a demo to learn more about how LogAlto can help your organization manage its result frameworks.
Subscribe to our Quarterly Newsletter!